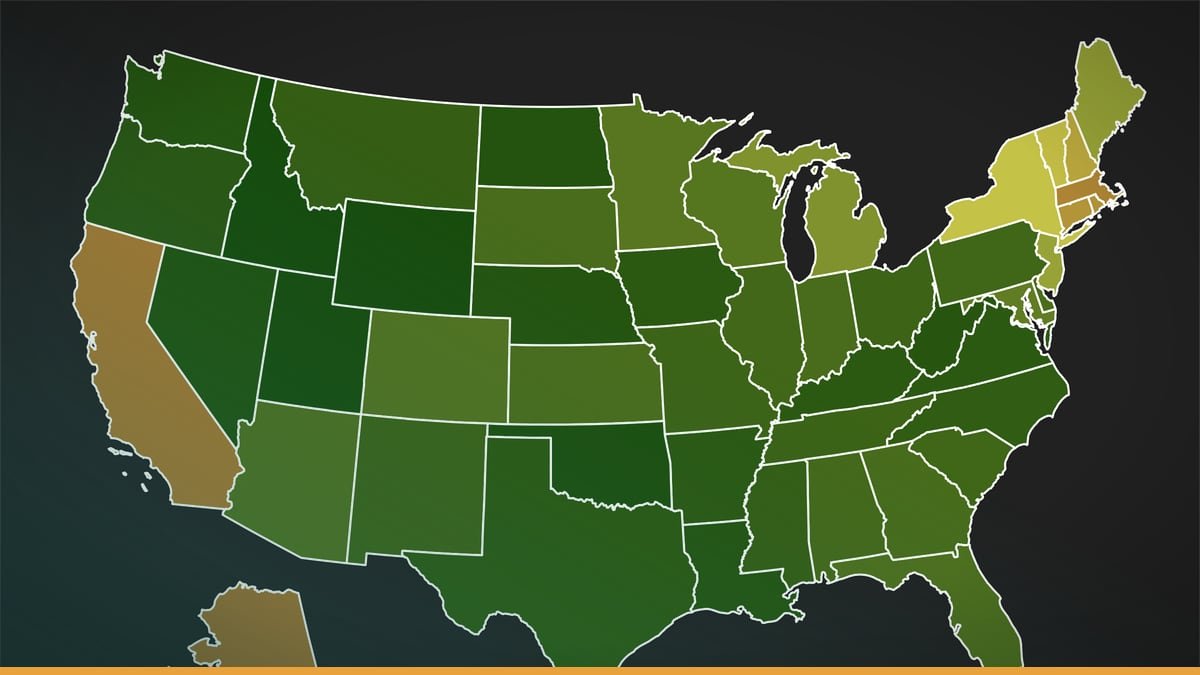
Header image: Average electric prices by Wizmut, CC BY-SA 4.0, via Wikimedia Commons — cropped to 16:9 and colour-adjusted.
Key takeaways
- Median home prices ($398k) are more reliable than averages for most buyers
- Different sources track different data: Zillow values vs Redfin sales
- Regional extremes make national averages misleading for local markets
Pick a number, any number. Different sources report different numbers: Zillow, Homelight, and the National Association of Realtors each have their own figures. The median price varies between $398,400 and $403,200 depending on the source. For anyone trying to buy, sell, or just understand the market, these aren’t minor discrepancies. They’re the difference between thinking a home is within reach and assuming you’ll rent forever.
So what’s the actual answer? There isn’t one. One reliable figure is Redfin’s median sale price of $398,596 for August 2026. That’s the point where half the homes sold cost more, and half cost less. It’s not perfect, but it’s the closest thing we have to a "typical" home price in America right now.
Why the Numbers Never Agree: Average vs. Median
Averages lie. Medians don’t. That’s not just a catchy phrase—it’s math.
Homelight reports an average of $514,600, but this figure can be misleading for many buyers. Why? Because it treats luxury properties the same as modest homes, skewing the result. The result is a number significantly higher than Redfin’s median. As one source explains, median price means half of homes sold for more and half sold for less than that amount. The National Association of Realtors reports a median existing-home price of $398,400 for February 2025. It cuts out the extremes.
Zillow’s average home value: $368,697, up 1.2% year-over-year. If you’re a buyer, the median is your friend. If you’re a seller in a high-end market, the average might make you feel richer than you actually are.
Who’s Reporting What—and Why It’s Not All the Same
The data source changes everything. Here’s how the numbers break down:
- Zillow: $368,697 average home value, up 1.2% year-over-year.
- Includes every home in the U.S., whether it’s for sale or not, using Zillow’s algorithm.
- Lower because it’s not just tracking sales—it’s estimating the value of homes that haven’t sold in years.
- Redfin: $398,596 median sale price, up 2.2% year-over-year.
- Only includes homes that actually sold, pulled from MLS data.
- Reliable because it’s real-time and reflects what buyers are actually paying.
- NAR: $398,400 median existing-home price for February 2025.
- Only resale homes (no new construction).
- Trusted because NAR is the industry standard for existing-home sales.
- Census/HUD: $502,700 average for August 2026.
- Both new and existing homes, including builder pricing.
- Higher because new construction tends to be pricier, and builders report their own data.
- Homelight: $514,600 average, $403,200 median.
- Aggregates data from multiple listing sources.
- The only source that explicitly gives both metrics, showing how averages can mislead.
The takeaway? Know what’s being measured. A "home value" (Zillow) isn’t the same as a "sale price" (Redfin). And unless you’re tracking luxury markets, the median (NAR, Redfin) is almost always more useful than the average (Homelight, Census/HUD).
Regional Extremes: Where the "Average" Is a Joke
National averages are fiction. Here’s the proof:
- Hawaii: Average home price $832,071. Median: $975,500 according to February 2025 Redfin data.
- Limited land, high demand, and a market dominated by luxury buyers. A "typical" home in Hawaii isn’t typical anywhere else.
- Florida: Median price $383,403 for August 2026, up 0.9% year-over-year.
Florida’s median is below the national median, but that doesn’t mean it’s cheap—it just means the extremes aren’t skewing the state’s numbers as much as Hawaii’s.
- West Virginia, Mississippi, and Louisiana have some of the lowest average home prices in the country.
In these states, more affordable homes are common, but national averages can make buyers think they’re priced out.
The lesson? A $400,000 home is a starter home in Ohio and a fantasy in San Francisco. National averages erase these differences. If you’re making decisions based on them, you’re flying blind.
How Prices Have Changed in 2026
The market isn’t crashing, but it’s not the free-for-all of 2021 either. Here’s the timeline:
- June 2026: Average price $475,400.
- July 2026: Average price jumps to $508,800.
- Seasonal demand (summer buying season) and limited inventory. Don’t assume this is the new normal.
- August 2026:
- Census/HUD average: $502,700.
- Redfin median: $398,596, up 2.2% year-over-year.
- Zillow’s average home value: $368,697, up 1.2% YoY.
The trend is clear: Prices are still rising, but the pace has slowed. The double-digit year-over-year gains of 2020–2022 are gone. Now, we’re seeing modest growth—enough to keep sellers happy, but not enough to trigger another affordability crisis.
The wild card? Mortgage rates. The brief doesn’t mention them, but they’re the invisible hand shaping buyer urgency. If rates stay high, prices might stagnate. If they drop, expect another surge.
What These Numbers Mean for You
Buyers
- Ignore national averages. A $500K average price doesn’t mean a $500K home is "typical. " Focus on median prices in your target city.
- Example: In Florida, the median is $383,403. In Hawaii, it’s $975,500. Same country, different planets.
- First-time buyers: The median price range is your benchmark. If you’re looking at homes priced at the average, you’re shopping in the top half of the market.
Sellers
- High-end markets: Averages matter. If you’re selling in Hawaii, Homelight’s average figure is a useful datapoint.
- Mid-tier markets: Medians are king. Price your home at or slightly below the local median to attract buyers.
Reality check: If your home is priced at the national average but your local median is much lower, you’re likely overpriced.
Investors
- Year-over-year growth suggests steady appreciation, but regional disparities are everything.
- Florida: 0.9% year-over-year growth. Not exciting, but stable.
- Hawaii: Extreme prices, but limited inventory = high barriers to entry.
- Opportunity: States with some of the lowest average home prices might offer better yields than high-growth markets with inflated prices.
Policymakers
- National averages obscure local crises. A median price is unaffordable in many cities, but averages can make it seem like the whole country is out of reach.
- Solution: Focus on local median incomes vs. local median home prices. In some areas, the gap is widening; in others, it’s manageable.
The Biggest Pitfall: Thinking "Average" Means "Typical"
Here’s the mistake everyone makes: Seeing a headline like "Average U.S. Home Price Hits $514,600" and assuming that’s what a "normal" home costs.
Case study: A buyer in Louisiana sees high national averages and thinks homes are unaffordable. But Louisiana’s median home price is likely much lower than national averages. The national average is irrelevant to them.
Why it matters:
- Buyers: Overestimating costs can scare you out of the market.
- Sellers: Underestimating demand can lead to overpricing.
- Investors: Misjudging affordability can lead to bad bets.
Solution: Always cross-check median prices and local data. If a headline cites a high average, it’s probably skewed by high-end sales. Medians are the real story.
The Future: Will Prices Keep Rising?
Short-term: Yes, but not dramatically.
- July to August 2026 saw a 6.2% MoM increase (Trading Economics), but that’s likely seasonal. Expect a slowdown in the fall.
- Zillow’s **1. Zillow’s year-over-year growth suggests cooling from the 2020–2022 frenzy.
Long-term: It depends on three unanswered questions:
- Mortgage rates: Will they stabilize or keep buyers on the sidelines?
- Inventory: Will new construction ease the shortage, or will demand outpace supply?
- Remote work: Will trends like "Zoom towns" (cheaper areas attracting remote workers) continue to reshape regional demand?
The brief doesn’t have the answers, but the data suggests a market that’s stable but fragile. Prices aren’t crashing, but they’re not surging either. For now, the median price range is the safest bet for predicting where things are headed.
How to Use This Data: A Practical Guide
For Buyers
- Step 1: Find the median home price in your target city/state (Redfin’s state-level data is a good start).
- Step 2: Compare it to your budget. If the median is above your budget, you’re shopping in the bottom half of the market.
- Step 3: Ignore national averages. They won’t help you.
For Sellers
- Step 1: Look up the median price in your ZIP code (Redfin or Zillow).
- Step 2: Price your home at or slightly below that number to attract buyers.
- Step 3: If you’re in a luxury market (e.g., Hawaii), use averages—but be realistic about demand.
For Analysts
- Step 1: Compare multiple sources. Zillow’s home values, Redfin’s sales data, and NAR’s existing-home prices all tell different stories.
- Step 2: Focus on year-over-year changes to gauge momentum, not just absolute numbers.
- Step 3: Watch regional extremes. A national median means nothing if your market is at extreme highs or lows.
Rule of Thumb
If a headline cites a high average, it’s likely skewed by high-end sales. Medians are more reliable for most decisions.
The Bottom Line
The average price of a home in the U.S. right now isn’t a number—it’s a range. At the low end, Zillow’s average home value reflects what homes are worth, not what they’re selling for. At the high end, Homelight’s average sale price is inflated by luxury markets. The truth lies in the middle: a median price range where half of buyers are paying more and half are paying less.
The real question isn’t about national averages but about local prices. It’s "What’s the price of a home where I want to live? " And for that, the national numbers are almost useless. The only figure that matters is the one on your local MLS. Everything else is just noise.
Now the open question: If mortgage rates stay high and inventory stays low, will the median price keep creeping up—or will buyers finally hit their breaking point?
Sources
- United States New Home Average Sales Price
- Median Home Price By State: How Much Houses Cost
- United States Housing Market: 2026 Home Prices & Trends
- Median Home Price By State: How Much Do Houses Cost?
- What’s the Average House Price in the USA?
- United States Housing Market & Prices
- Florida Housing Market: House Prices & Trends
Leave a Reply